

Marginal revenue is the dollar amount added to the total revenue when a business increases its output or sales.
To calculate marginal revenue, you take the total change in revenue and then divide that by the change in the number of units sold.
The marginal revenue formula is: marginal revenue = change in total revenue/change in output. If you want to skip ahead and run the numbers, use our marginal revenue calculator to compute MR across multiple production levels.
Marginal revenue is most valuable for identifying the sales inflection point where costs begin to exceed your revenue, allowing managers to make informed decisions about the unit economics of production. Calculating marginal revenue is also particularly valuable if a business is trying to understand how high its costs are relative to output.
Marginal revenue as a single calculation is simple enough to understand, but it is only one part of a larger picture outlining the financial well-being of a business’s output.
This article will go deeper into how calculating marginal revenue will provide valuable insights for a business. Also, in this article, I will discuss:
- The definition and importance of marginal revenue
- How to calculate marginal revenue for your business
- The marginal revenue curve
- Other metrics that are important to understand marginal revenue
What is marginal revenue?
Marginal revenue is the addition to total revenue associated with a unit increase in output or sales.
Marginal revenue is most commonly compared to marginal cost; marginal cost is the money spent on producing one additional unit.
The summation of your revenue is known as the total revenue, total revenue increases when marginal revenue is positive, and total revenue decreases when marginal revenue is negative.
Calculating marginal revenue is often considered a process for forecasting the unit economics of businesses with a primary focus on manufacturing and production capabilities. However, calculating marginal revenue can also be used for service-based companies. A unit of service is similar to a physical product as it has costs associated with offering each unit of that service.
For example, services with increasing costs, like paying overtime salary, would want to know when their marginal cost reaches their marginal revenue.
Also, it could be possible that the service provided is so readily available that the price of the service has decreased to the point that it is equal to the cost of providing the service, therefore no longer being financially prudent to keep the service.
To make this discussion about marginal revenue simpler, I’ll refer to both products and services in terms of single units produced and sold.
Why is calculating marginal revenue necessary?
Learning how to calculate marginal revenue can help analyze consumer demand, forecast production schedules, and set the pricing of units. If a business were to produce too few units, they could lose on potential sales, and producing too many units will incur unnecessary costs.
To summarize, calculating marginal revenue is a financial exercise in determining whether a business can generate more revenue from selling additional units.
Marginal revenue: detailed example
Let’s break it down further with an example, if you created and sold 1000 units of a product, you could do a production run of 1500 units. It’s more than likely that the 1500 units will need to be sold at a lower price point to sell out. After more consideration, you decide to produce 2000 units. Perhaps, at 2000 units, the marginal revenue has decreased so much that it is now lower than the marginal cost.
In this exercise, you would want to identify where your marginal revenue dropped below your marginal cost before producing those 2000 units to avoid the potential loss in revenue.
Inversely a business may not realize they are selling too few units. In that case, their marginal revenue has yet to meet the marginal cost. By calculating and identifying the inflection point where revenue meets cost, the business can maximize production and profits.
How to calculate marginal revenue?
To calculate marginal revenue, you divide the change in total revenue by the change in total output quantity. Take the total revenue that the business earned before adding additional units and then subtract the total revenue after the additional units have been added. This will provide the change in total revenue. Divide this change of total revenue by the change in output of units, and the remaining number is your marginal revenue.
For example, if you sell ten items for a total of $100 and then produce one more item and sell it for a discounted $9, your total revenue is $109. Your marginal revenue on that last item is also $9. Even though you now sold eleven items, we are only concerned with calculating the marginal revenue of the additional item and not the total of eleven products sold.
Marginal revenue formula
Marginal revenue = change in total revenue / change in output
The result is the change in total revenue created by one additional unit of output.
In algebra, the formula would look like this:
MR = ΔΤR / ΔQ
MR = Marginal Revenue
ΔΤR = Change in Total Revenue
ΔQ = Change in output or quantity
Let’s look at a simple example where I incrementally produce and sell one unit more at varying price points. In this example, the denominator (ΔQ) is always one.
Note that the total revenue is what you sell at each stage for all units produced at that price point. A business does not typically sell one unit for one price and then a second unit for another price. They sell a product for one set price to the market, and the marginal revenue is calculated from there.
| Quantity | Price | Total Revenue | Marginal Revenue |
|---|---|---|---|
| 0 | $50 | $0 | |
| 1 | $45 | $45 | $45 |
| 2 | $35 | $70 | $25 |
| 3 | $30 | $90 | $20 |
| 4 | $25 | $100 | $10 |
| 5 | $20 | $100 | $0 |
| 6 | $15 | $90 | -$10 |
We can see above that as the number of units sold increases and the price decreases, the total revenue eventually reaches a point where the marginal revenue reaches zero. If I were to sell any additional units past this point, it would result in negative marginal revenue.
One more note that should be evident in the table, marginal revenue is not an average of your total revenue; it is only the increase affected upon the total revenue as additional units are added.
To further understand why the price decreases as the quantity increases, we can look at the marginal revenue curve.
What is a marginal revenue curve?
The marginal revenue curve is a graph that can represent the relation between the marginal revenue earned and the number of products sold.
Depending on your industry’s competitive landscape, the marginal revenue curve can have a broad spectrum of variations.
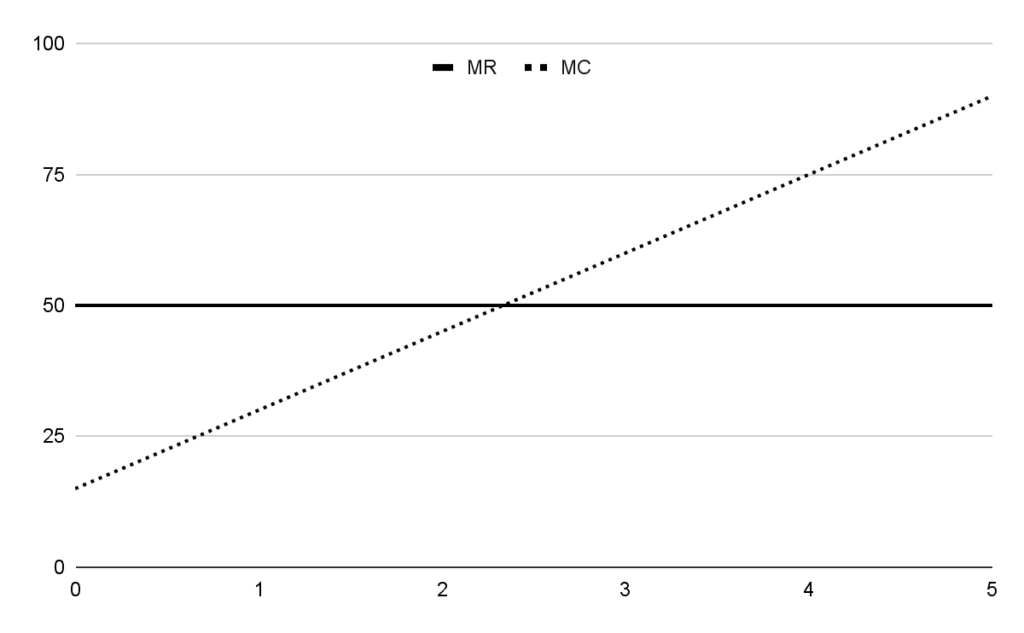
In a highly competitive market, you would have little wiggle room to set your pricing. Graphically,
marginal revenue would be illustrated as a straight horizontal line. This is because the market sets the prices. One classic example is products like corn or sugar. These products are so abundant and produced by so many farmers (competitors) that the pricing stays reasonably consistent.
Since the pricing is consistent, the marginal revenue will also maintain consistency regardless of the quantity produced. A rational business would then produce the quantity where the horizontal marginal revenue meets its slope of marginal cost. Below is a simple illustration of a perfectly competitive market.
An example would be a pharmaceutical company that holds the patent or license to produce a specific medication or ingredient.
In theory, the only way to increase sales for a monopoly would be to lower the product’s price to follow the demand curve. In this instance, the demand of the product controls the pricing and thus the marginal revenue. The business would then continue to lower the price until it reaches the line of marginal cost.
In reality, almost all markets are somewhere near an imperfectly competitive market. There are multiple variations to an imperfectly competitive market. Commonly there are multiple competitors with some variations of similar products trying to sell their products or services, more on this in just a minute.
Marginal revenue relative to a demand curve
Marginal revenue is almost always displayed alongside a demand curve. A demand curve is a relation between the number of units a producer can sell and the price point for which the units should be sold.
This principle of demand responding to prices changes is known as elasticity. As the price of a unit goes down, the demand should increase. If pricing does not affect demand for a product, this would be referred to as inelasticity. Most products do have some elasticity and would follow an expected demand curve.
Below is a graph from the Journal of Economic Literature to illustrate the relation of demand, marginal revenue (MR), and marginal cost (MC).
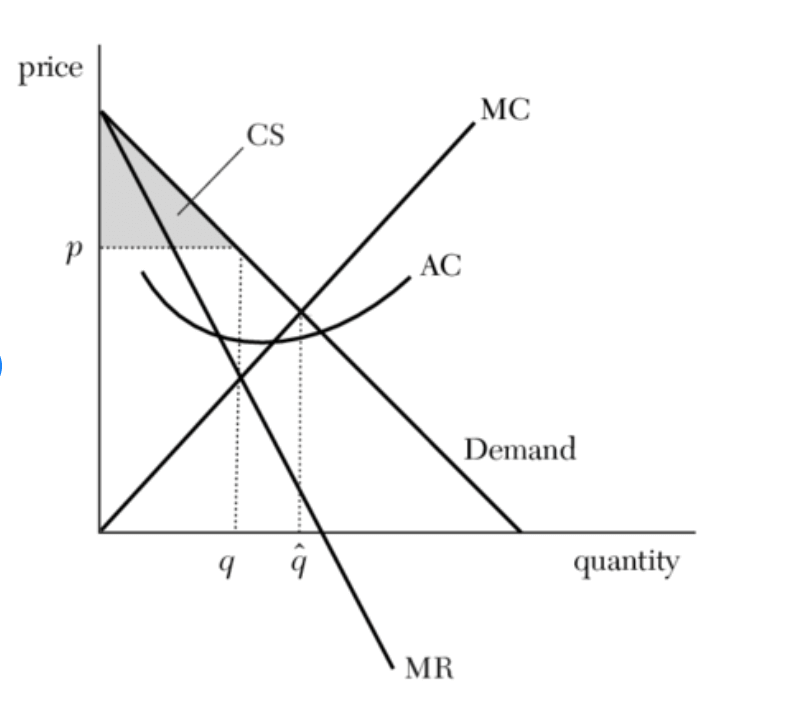
In this graph of imperfect competition, marginal revenue and marginal cost intersect at q to provide the optimal point of production.
The marginal revenue curve illustrates the degree to which a business has market control and can control its pricing. Note that the point at which MR and MC intersect is below the line of demand. In economics, this would be known as a market inefficiency. Even though there is more demand for the product at the current marginal cost, it would not make sense to produce a higher quantity of units.
Doing a cost-benefit analysis for marginal revenue
Once the marginal revenue has reached zero, it’s most prudent to take a step back and assess the product and its associated costs. This analysis will provide insights into what the next steps for the product should be.
The simplest method is by conducting a cost-benefit analysis of the product to break down all the financial aspects of the product to decide the next course of action. In certain instances, an analysis could provide further insight into why the product has reached a marginal revenue of zero, or ideally, what can be done to lower the costs and continue additional output to match demand.
The Harvard Business School has a great article on the first steps to conduct a cost-benefit analysis here.
Critical Take-Aways for calculating marginal revenue
The equation for calculating marginal revenue is simple enough to track the numbers you need to find where it meets your marginal cost.
Five key concepts to remember that I covered in this article are:
- Marginal Revenue: The dollar amount that is added to the total revenue when a business increases its output or sales.
- Marginal Cost: Marginal cost is the dollar amount of cost associated with producing one additional unit.
- Marginal Revenue Curve: A graphic illustration of the relation between marginal revenue, marginal cost, and market demand. The slope of which can vary depending on the competitiveness of the market.
- Elasticity: Elasticity is the degree to which the price of a product affects the demand for the product.
- Cost-Benefit Analysis: A strategic analysis you can complete for weighing the costs and perceived benefits of the product or service. It will help determine how best to move ahead with the production of units once you have reached the point where marginal revenue and marginal cost intersect.
Once marginal revenue is calculated and understood, it’s vital to take the next steps to understand how marginal revenue is tracked in relation to marginal costs and the demand curve of your market so your business can decide its strategy on what to do next.
 How to Create a LinkedIn Content Marketing Strategy